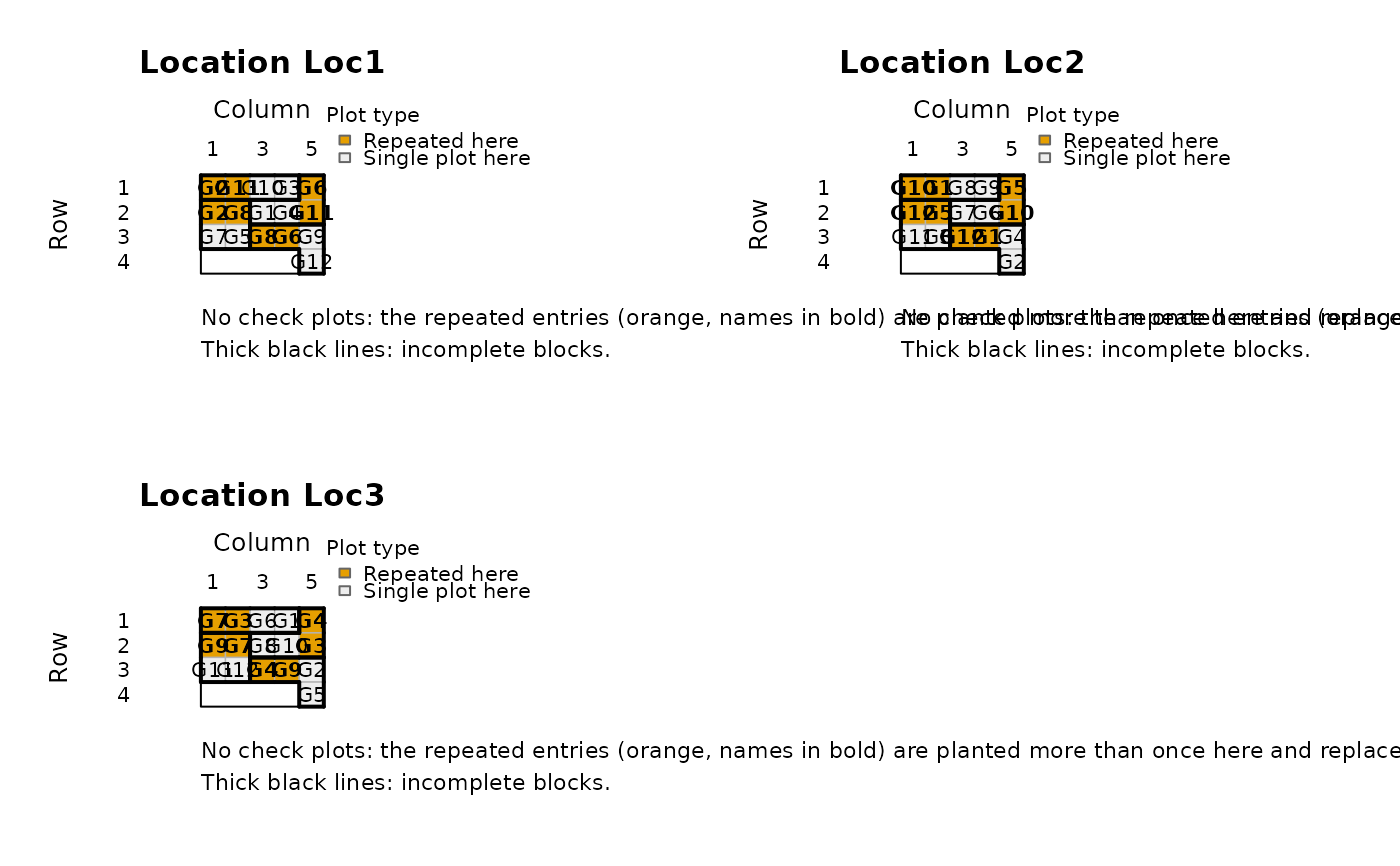
Draws one field map per location for an augmented p-rep design.
Usage
plot_augmented_prep_design(
  design,
  locations = NULL,
  label = c("all_entries", "entry_type", "repeated_at", "block", "replicate", "none"),
  fill = c("entry_type", "is_extra_repeat", "repeated_at", "block", "replicate"),
  show_plot_labels = TRUE,
  show_block_labels = FALSE,
  block_label_position = c("background", "center"),
  label_cex = NULL,
  block_label_cex = NULL,
  block_label_col = NULL,
  block_lwd = 2,
  main = NULL,
  legend = TRUE,
  caption = TRUE,
  ...
)
Arguments
- design
An object returned by
augmented_prep_design()or itsdesigndata frame.- locations
Optional character vector of locations to plot. Defaults to all locations in design order.
- label
Cell label to show. Use
"all_entries","entry_type","repeated_at","block","replicate", or"none".- fill
Cell coloring variable. Use
"entry_type","is_extra_repeat","repeated_at","block", or"replicate".- show_plot_labels
Logical. If
TRUE, labels are printed inside cells unlesslabel = "none".- show_block_labels
Logical. If
TRUE, block numbers are printed. Defaults toFALSEso block labels do not overlap accession labels.- block_label_position
Position for block labels when
show_block_labels = TRUE. Use"background"for a faint watermark behind accession labels or"center"for a regular center label.- label_cex
Optional text size for plot-cell labels.
- block_label_cex
Optional text size for block labels.
- block_label_col
Color for block labels.
- block_lwd
Line width for block boundaries.
- main
Optional plot title. If multiple locations are plotted, a single value is combined with the location name; a vector matching the number of locations is used panel by panel.
- legend
Logical. If
TRUE, draw a legend for cell colors.- caption
Logical. If
TRUE, print a short explanation of the colours and lines under each map.- ...
Additional arguments passed to
graphics::plot.window().
Details
A p-rep design has no check plots: at each location some entries are planted more than once (repeated entries), and these replace the checks for estimating the error and the block effects. By default the map colours the repeated entries (orange, names in bold) and the entries with a single plot at that location (light grey). Thick black lines outline the incomplete blocks; in resolvable designs a thick blue line separates the replicates, which are labelled at the right. A caption under each map explains this.
Examples
design <- augmented_prep_design(
  treatments = paste0("G", seq_len(12)),
  locations = c("Loc1", "Loc2", "Loc3"),
  block_size = 5,
  n_candidates = 5,
  seed = 123,
  field_cols = 5
)

plot_augmented_prep_design(design)